Infographic Design Services
Infographics offer a uniquely engaging medium to share data, statistics or quick bits of information. This method of visual communication encourages your audience to interact with your brand.
Learn more about infographic design with Brafton:
By entering your email address, you agree to receive emails from Brafton in accordance with our Privacy Policy.
You may unsubscribe from these communications at any time.

The Visual Communication Your Audience Needs
Infographics give your brand a visual lift by synthesising complex data into digestible custom infographic assets that drive value.
Did you know? Brain studies have shown that pairing text with design elements like graphics increases information retention over a longer period of time. Great design is how your brand stays top of mind.
With Brafton’s skilled infographic design team by your side, you’ll convert new customers and establish industry expertise through designing infographics and other graphical assets in no time.
View Our Latest Infographics:
The Brafton Approach to Infographics
Graphic design is a multi-team and multi-step effort:
Types of Infographics
Infographics come in all different shapes and sizes, and they can be used to convey a huge range of data. Choosing which type of infographic works best for your marketing needs really comes down to the type of information you’re trying to convey — and what you want your users to learn.
Here are some of the different types of infographics our designers create at Brafton:
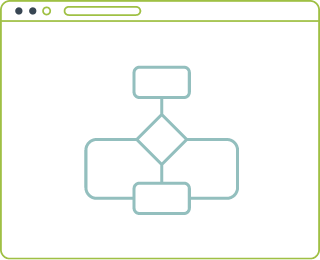
Flowchart Infographic
This type of infographic illustrates a series of steps or sequences, showing how one leads logically to the next and making it easy for viewers to understand a complex process.
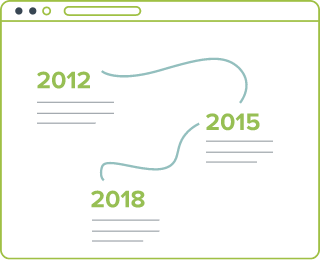
Timeline Infographic
These infographics plot key moments in time so viewers can see how one event relates to the next. These types are especially useful when telling a company story or product history.
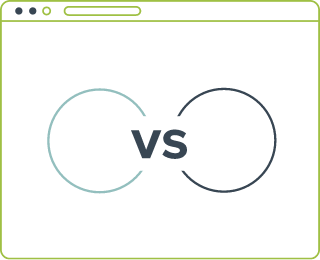
Comparison Infographic
Side-by-side comparisons help users visualise the differences (and even the similarities) between two concepts, ideas, products or companies, depending on your needs.

Data Visualisation Infographic
Data can be hard to conceptualise, especially in raw form. This style of infographic minimises text by adding images, graphs and other illustrations to really bring your data points to life.

List-based Infographic
The opposite of data visualisation, list-based infographics place compelling text into a list format to tell a great story, while also using arresting colours and images to support text.
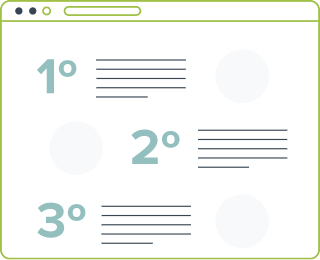
Process Infographic
Directions are best conveyed by putting bite-sized information in a step-by-step format. This type of infographic allows you to create straightforward how-to guides that are fast and easily digestible.
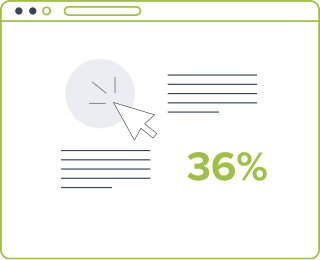
Interactive Infographic
Newer to the world of infographics, this style adds a whole layer of user engagement to the infographic experience. Readers can swipe, zoom, click, take polls, complete quizzes and so much more.
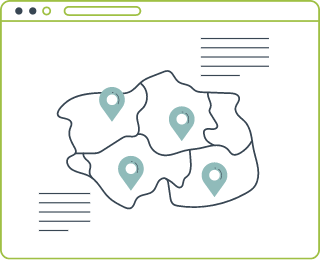
Geographic Infographic
Maps can be hard to visualise, but they can convey so much information. These infographics let you ground data into specific locations to better tell specific stories (like national income levels).
Where Infographics Fit Into Your Content Marketing Strategy
It’s simple: People are visual learners. They also engage more with online visual content. That means if you really want to reach your customers (and potential customers) with your content, you should be incorporating imagery, photos and illustrations into your content marketing strategy.
That’s where infographics come in. Condense and package the complex information you really want your customers to know into an infographic to make it easy for them to digest, helping to raise your brand awareness while creating value at the same time. Infographics are also great for social media engagement because users are quick to share a beautiful infographic they found particularly valuable.
But don’t let your infographics stand on their own. It’s important to create blogs, white papers, eBooks and other forms of text-based content surrounding your infographics. The best infographics don’t replace these other forms of content — they reinforce them.
Want to learn more about our infographic services? Our trained strategists will help you craft the ideal combination of marketing assets to maximise ROI. Contact us today for a quote.
Not in the UK?
In the US?
In Australia?
In Germany?